New Report: Demographics & Voting Trends of Key 2018 Groups
September 26 is National Voter Registration Day… and to commemorate this occasion, we’re teaming up with Lake Research Partners to release the most comprehensive political analysis of the Rising American Electorate in the 2016 elections.
In 2016, for the first time in American history, the Rising American Electorate — which makes up the majority of citizens eligible to vote at 59.2% — also cast the majority of ballots, at 52.6%. But nearly two-thirds of the projected drop-off for the 2018 election will come from the RAE, and large percentages of unmarried women (32.5%), Latinos (42.7%), and millennials (39.3%) aren’t registered to vote — underscoring the huge potential of the RAE and the importance of making sure that every eligible American is registered to vote.
The report provides a thorough breakdown of demographic information from the 2016 election including dissecting data by state, analyzing how ballots were cast, comparing registration and turnout rates, population mobility, methods of registration, reported reasons for not registering, economic factors and expected 2018 drop off.
Downloads
Comparing the Voting Electorate in 2012-2016 and Predicting 2018 Drop-Off
As part of our ongoing efforts to understand the voting patterns of the Rising American Electorate, we’ve worked with Lake Research Partners to produce this report, which catalogues the changes in voting turnout for the Rising American Electorate between 2012 and 2016 – and makes projections for voter drop-off in 2018.
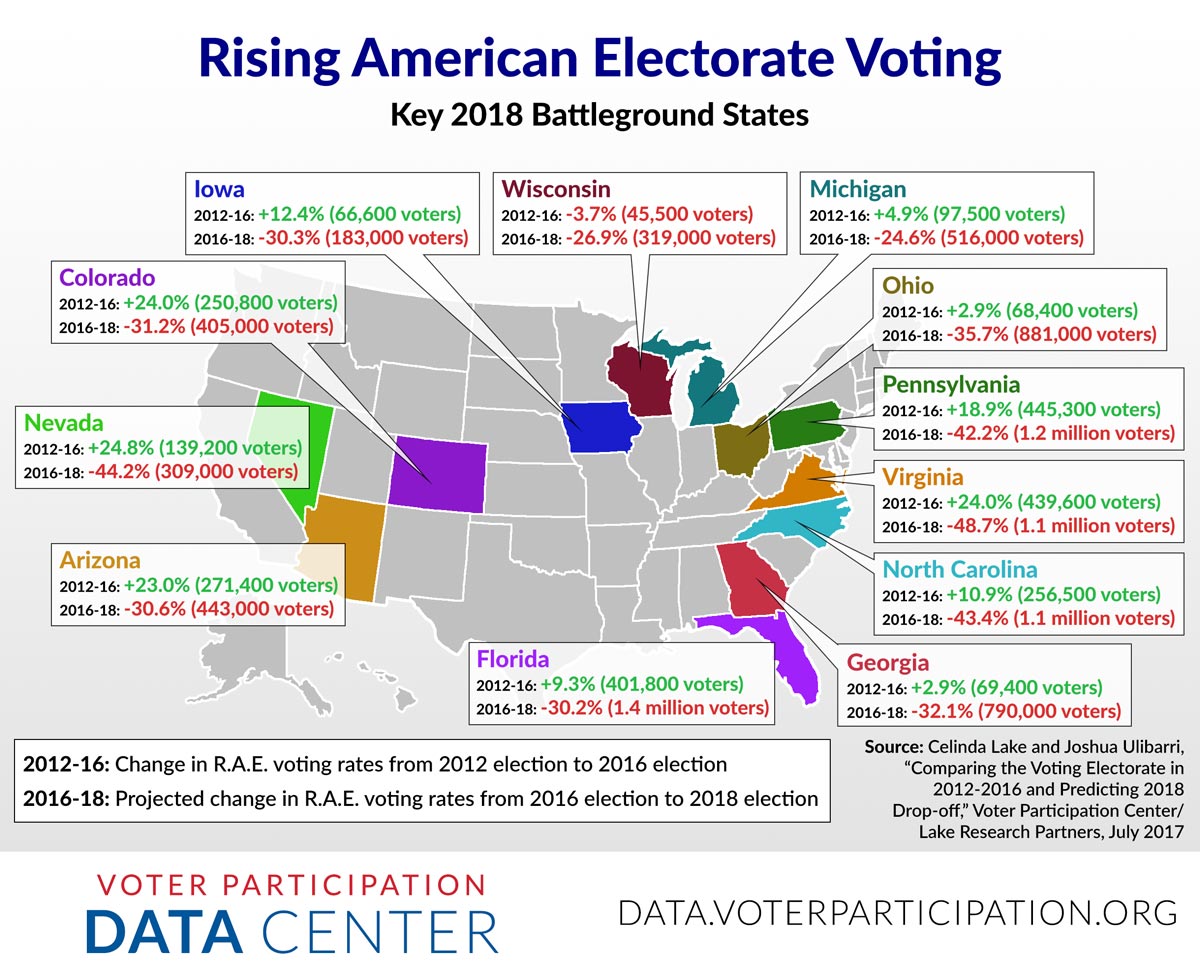
The projections are sobering and troubling to everyone who cares about increasing participation in our great democracy. Our prediction is that 40 million Americans who voted in 2016 won’t cast a ballot in the 2018 midterms — and to make matters worse, 2/3 of those drop-off voters will be members of the Rising American Electorate. The RAE dropoff is projected to be particularly pronounced in key 2018 battleground states, such as Arizona, Nevada, Florida, and Ohio:
Add in the effects of ongoing vote suppression efforts and the implication is clear: Democracy is facing a headwind in 2018. We need to double down on voter registration, mobilization and turnout efforts, and fighting for voting rights in order to make sure that every American has the opportunity to raise their voice at the ballot box.
Downloads
Why did Trump win? More whites — and fewer blacks — actually voted.
Check out this deep dive from four Washington Post reporters:
“Using data from the voter file vendor Catalist and information from the U.S. Census Bureau, we examine the change in turnout rates for different racial/ethnic groups between 2012 and 2016. Black turnout declined dramatically; white turnout increased noticeably; and Latino and Asian American turnout went up even more. In the key swing states of Michigan, Wisconsin, and Pennsylvania, those shifts were especially strong. How strong? Without those shifts in turnout from various racial and ethnic groups, these pivotal states might have gone not to Trump but to Clinton — giving Clinton an electoral college victory.”
Two graphics in their piece show the stark difference in turnout:
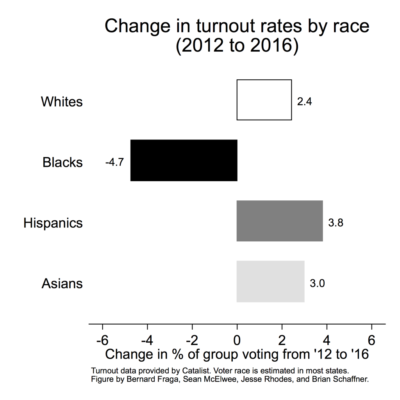
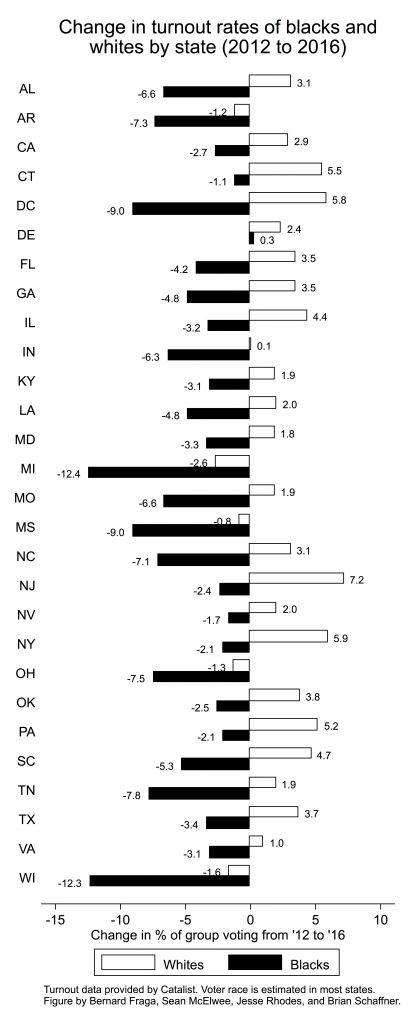
“As you can see, the national average hides dramatic differences among states. For example, as we’ve said, the African American turnout rate fell by 4.7 points nationally. But in Michigan and Wisconsin — two key Midwestern states where, to analysts’ surprise, Trump won — black turnout fell by more than 12 points.
Similarly, overall white turnout increased by only 2.5 points nationally. But in several states it surged by more than 5 points. In the critical battleground state of Florida, white voter turnout jumped by 4 points — and black turnout fell by 4 points. Trump won Florida by a margin of just 1.2 points.”
So, in the end, what impact did decreased / depressed turnout of Black voters have on the election?
“If we changed nothing but the turnout rates of various racial and ethnic groups, in Michigan, the actual Clinton loss by .2 percentage points would have become a victory by 1.5 percentage points. Clinton’s actual loss by 0.7 percentage points in Pennsylvania would have been a 0.5 percent victory. And instead of Trump winning Wisconsin by 0.8 points, Clinton would have won by 0.1 percent. Clinton’s electoral college total would have been 278 votes, putting her in the White House.”
“Of course, these measures are estimates and subject to error. Interpret cautiously. But what’s clear is that the jump in white turnout in key swing states and drop in black turnout may well have handed the presidency to Trump.”
Wisconsin’s Voter-ID Law Suppressed 200k Votes in 2016 (Trump Won by 22,748)
Ari Berman writes in The Nation:
A new study by Priorities USA, shared exclusively with The Nation, shows that strict voter-ID laws, in Wisconsin and other states, led to a significant reduction in voter turnout in 2016, with a disproportionate impact on African-American and Democratic-leaning voters. Wisconsin’s voter-ID law reduced turnout by 200,000 votes, according to the new analysis. Donald Trump won the state by only 22,748 votes.
The study compared turnout in states that adopted strict voter-ID laws between 2012 and 2016, like Wisconsin, to states that did not.”
“While states with no change to voter identification laws witnessed an average increased turnout of +1.3% from 2012 to 2016, Wisconsin’s turnout (where voter ID laws changed to strict) dropped by -3.3%. If turnout had instead increased by the national- no-change average, we estimate that over 200,000 more voters would have voted in Wisconsin in 2016.”
Read the full story at The Nation.
Washington Post: Do voter identification laws suppress minority voting? Yes. We did the research.
New research published in the Washington Post confirms one of the worst-kept secrets in politics: Voter ID laws suppress minority voting.
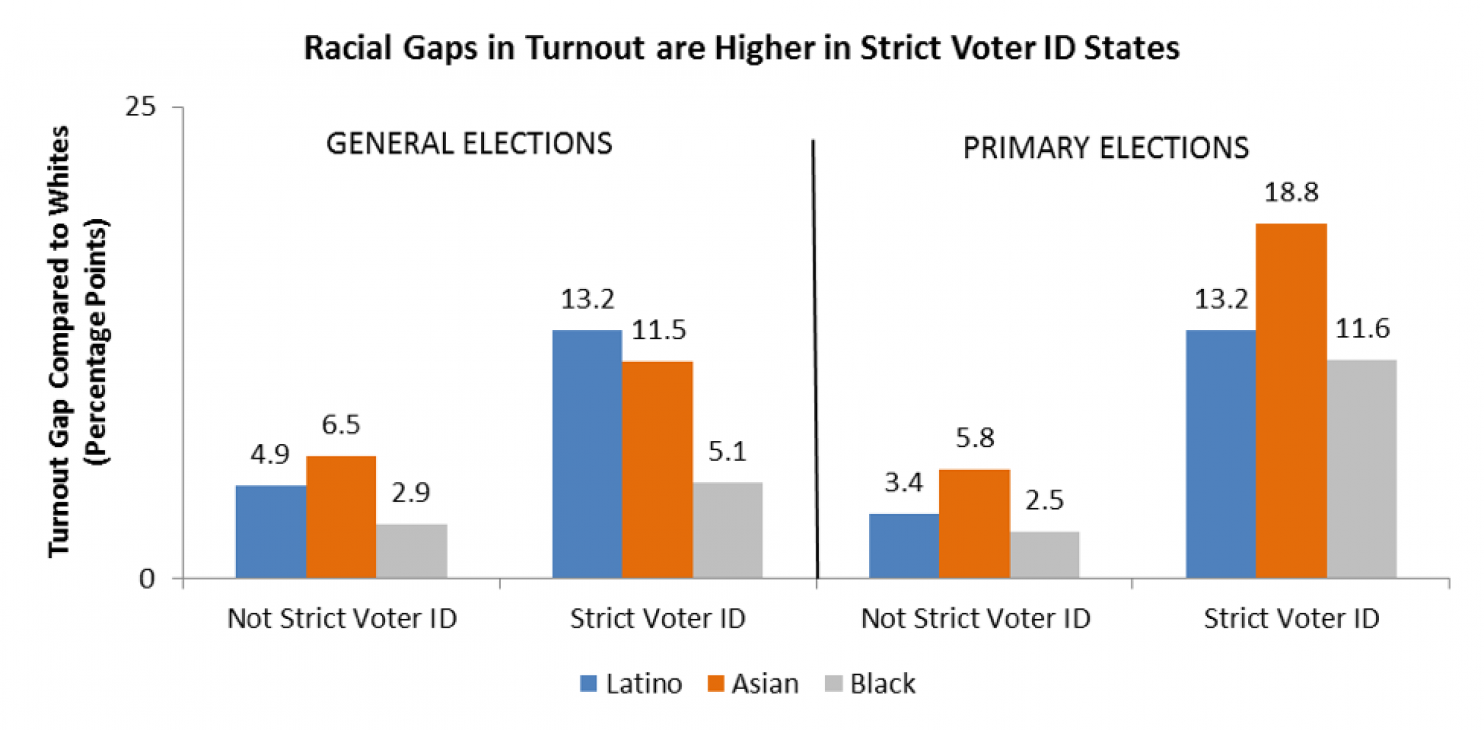
“When we compare overall turnout in states with strict ID laws to turnout in states without these laws, we find no significant difference. That pattern matches with most existing studies. But when we dig deeper and look specifically at racial and ethnic minority turnout, we see a significant drop in minority participation when and where these laws are implemented.
Hispanics are affected the most: Turnout is 7.1 percentage points lower in general elections and 5.3 points lower in primaries in strict ID states than it is in other states. Strict ID laws mean lower African American, Asian American and multiracial American turnout as well. White turnout is largely unaffected.
These laws have a disproportionate effect on minorities, which is exactly what you would expect given that members of racial and ethnic minorities are less apt to have valid photo ID.”
Data on the Women's March: This is what Democracy Looks Like!
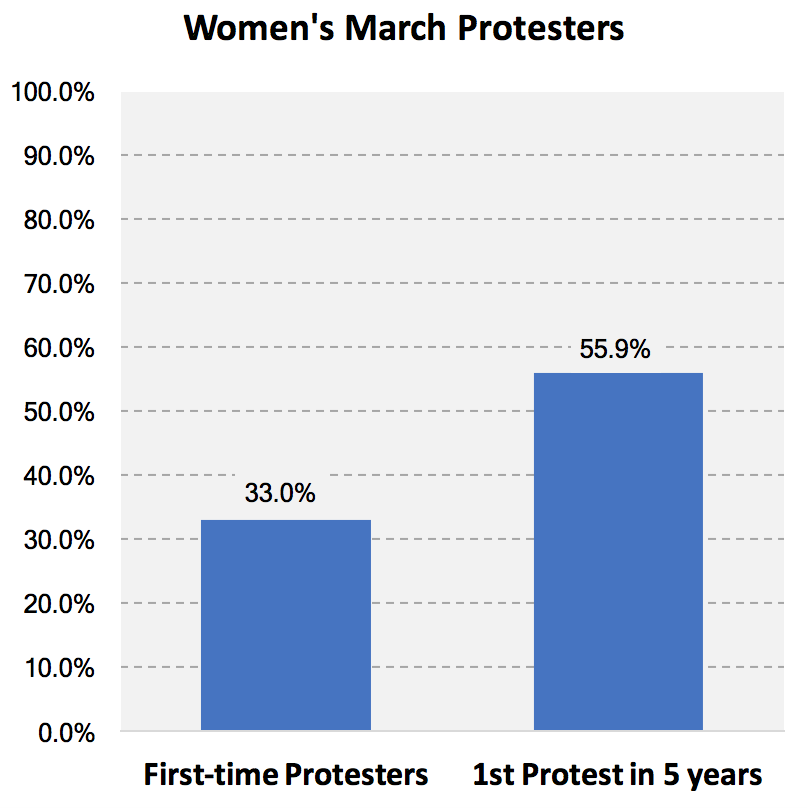
The numbers are in: “The Women’s March of 2017 was the largest protest in recent history, bringing together over 500,000 people in DC- the location of the flagship march, and over 2.9 million people nationwide.”
Their findings “suggest that the Women’s March has potentially lit the political fires of a new generation of activists and reactivated the political activism of others. Indeed, a third of the participants reported that the Women’s March was their first time participating in a protest ever. For over half of the participants (55.9%), the March was their first protest in 5 years (including those who had never participated before).”
WVWVAF / Democracy Corps Election Night Survey: Why?
Our sister organization, Women’s Voices Women Vote Action Fund, and Democracy Corps surveyed 1,300 voters between Nov. 7 and Nov. 9, 2016, including an oversample of 200 Rising American Electorate voters and 200 battleground state voters (AZ, FL, OH, IA, NC, NV, NH, PA, VA, WI). Select highlights are below; you can read the full survey here.
Voters Dissatisfied With Economy’s Progress and Fairness

Lots of Rising American Electorate, including unmarried women, thought Trump expressed legitimate frustration

Great New Interactive Feature from Pew: The Elections Performance Index
The Pew Charitable Trusts have just published a new Elections Performance Index, an interactive feature with data from “the first comprehensive assessment of election administration in all 50 states and the District of Columbia.”
Using indicators for ballot access and ease of voting like voter turnout, registration rate, registration or absentee ballot problems, and voting wait time, they’ve assigned each state a percentage score for its election administration for every federal election from 2008 to 2014. In the 2014 election, the state with the best score was was North Dakota, with 84%; the bottom-scoring state was Alabama, with 49%.
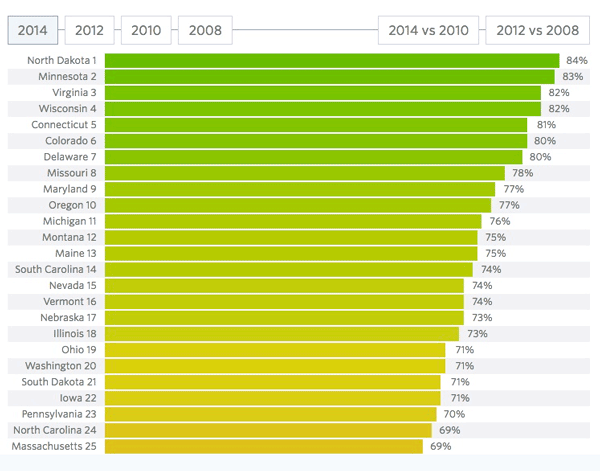
In their interactive data feature, you can view each state’s scores on all of the individual indicators, a ranked list of all the states, or compare states’ scores from election to election. It’s a great tool to see how voters in many states still face significant challenges in order to raise their voice in our democracy.
How does your state stack up in Pew’s rankings? Find out here.
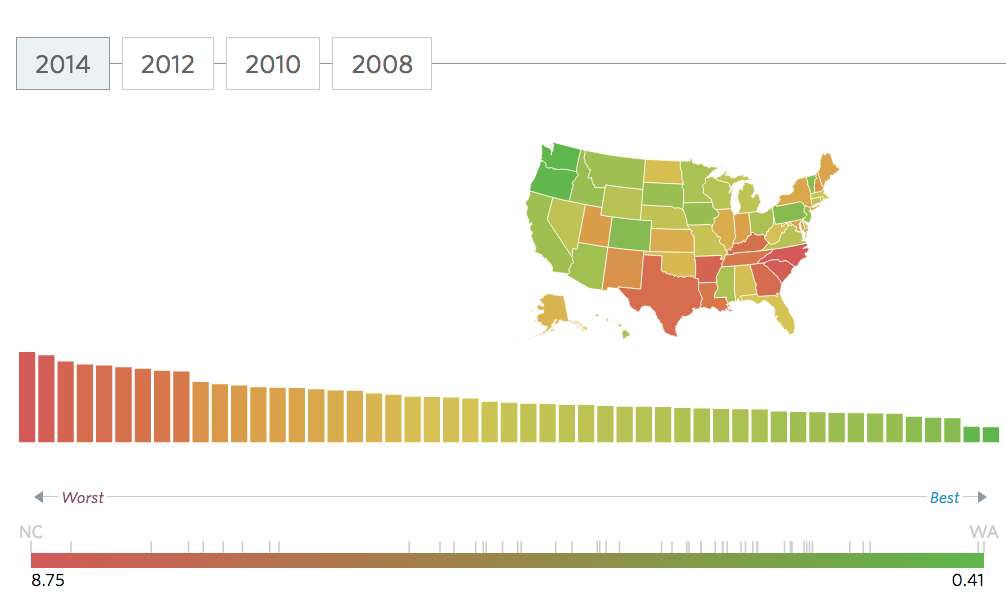
Pew Elections Performance Index: Voting Wait Time
The Pew Trusts’ Election Initiatives Project tracks a number of data points that provide insight into each state’s voting landscape: among these are turnout, voter registration, and the availability of online registration. One of the most telling indicators of a state’s success in managing elections is Voting Wait Time.
Although long waits can indicate excitement surrounding an election, significant variation in polling place lines across precincts and communities may mean that inefficient administration is making voting more difficult for some voters. Average wait time is one measure of the ease of voting: The less time a voter waits to cast a ballot, the more convenient the experience.
How does your state measure up? Find out at PewTrusts.org.
2016 Primary Spotlight: Indiana
Indiana’s standalone primary on May 3 has emerged as a must-win for Republican Ted Cruz. Both Donald Trump and Hillary Clinton come into the state with momentum from their multi-state wins last Tuesday. There are 57 delegates at stake in Indiana’s GOP primary, and 92 in the Democratic primary. The Rising American Electorate (RAE)—the unmarried women, people of color, and millennials who make up 57% of eligible voters nationally—make up only 46% of Indiana’s voting-eligible population. Unmarried women make up the largest percentage of the RAE in Indiana. Learn more about their lives.