New Report: Demographics & Voting Trends of Key 2018 Groups
September 26 is National Voter Registration Day… and to commemorate this occasion, we’re teaming up with Lake Research Partners to release the most comprehensive political analysis of the Rising American Electorate in the 2016 elections.
In 2016, for the first time in American history, the Rising American Electorate — which makes up the majority of citizens eligible to vote at 59.2% — also cast the majority of ballots, at 52.6%. But nearly two-thirds of the projected drop-off for the 2018 election will come from the RAE, and large percentages of unmarried women (32.5%), Latinos (42.7%), and millennials (39.3%) aren’t registered to vote — underscoring the huge potential of the RAE and the importance of making sure that every eligible American is registered to vote.
The report provides a thorough breakdown of demographic information from the 2016 election including dissecting data by state, analyzing how ballots were cast, comparing registration and turnout rates, population mobility, methods of registration, reported reasons for not registering, economic factors and expected 2018 drop off.
Downloads
Wisconsin’s Voter-ID Law Suppressed 200k Votes in 2016 (Trump Won by 22,748)
Ari Berman writes in The Nation:
A new study by Priorities USA, shared exclusively with The Nation, shows that strict voter-ID laws, in Wisconsin and other states, led to a significant reduction in voter turnout in 2016, with a disproportionate impact on African-American and Democratic-leaning voters. Wisconsin’s voter-ID law reduced turnout by 200,000 votes, according to the new analysis. Donald Trump won the state by only 22,748 votes.
The study compared turnout in states that adopted strict voter-ID laws between 2012 and 2016, like Wisconsin, to states that did not.”
“While states with no change to voter identification laws witnessed an average increased turnout of +1.3% from 2012 to 2016, Wisconsin’s turnout (where voter ID laws changed to strict) dropped by -3.3%. If turnout had instead increased by the national- no-change average, we estimate that over 200,000 more voters would have voted in Wisconsin in 2016.”
Read the full story at The Nation.
New Poll on Turnout Voters and Swing Voters - in 2016 and Beyond
A new PrioritiesUSA poll from Global Strategy Group and Garin Hart Yang provides important insight to two voting groups that were critical in the 2016 election: “swing voters” who supported Obama in 2012, and Trump in 2016, and “turnout voters” who voted in 2012, but stayed home in 2016. The research included a survey of 801 Obama/Trump voters, and focus groups in key swing states.
Key insights from the poll:
- In particular, non-college women present a key opportunity. Non-college women make up the largest proportion of Obama-Trump voters with mixed feelings about voting for Trump and thus present a particularly promising opportunity for persuasion efforts.
- Turnout voters – those who voted in 2012, but not 2016 – are disillusioned about politics, but extremely unhappy about the idea of a Donald Trump presidency. They were surprised about the 2016 outcome and are distraught about the prospect of four years under Trump.
- Turnout voters are also concerned about how Trump may unravel core protections that they value. Drop-off voters are concerned Trump will undermine women’s rights, do serious damage to the environment, and promote a divisive agenda.
WVWVAF / Democracy Corps Election Night Survey: Why?
Our sister organization, Women’s Voices Women Vote Action Fund, and Democracy Corps surveyed 1,300 voters between Nov. 7 and Nov. 9, 2016, including an oversample of 200 Rising American Electorate voters and 200 battleground state voters (AZ, FL, OH, IA, NC, NV, NH, PA, VA, WI). Select highlights are below; you can read the full survey here.
Voters Dissatisfied With Economy’s Progress and Fairness

Lots of Rising American Electorate, including unmarried women, thought Trump expressed legitimate frustration

538: Men are treating 2016 as a normal election. Women aren't.
Harry Enten at FiveThirtyEight sums up the current polling:
We could be looking at the largest gender gap in a presidential election since at least 1952…The last time women favored either party’s nominee by more than 20 percentage points was in 1972, when Republican Richard Nixon crushed Democrat George McGovern among both sexes. The only Democrat ever to win women by more than 20 points was Lyndon Johnson in 1964.”
Great New Interactive Feature from Pew: The Elections Performance Index
The Pew Charitable Trusts have just published a new Elections Performance Index, an interactive feature with data from “the first comprehensive assessment of election administration in all 50 states and the District of Columbia.”
Using indicators for ballot access and ease of voting like voter turnout, registration rate, registration or absentee ballot problems, and voting wait time, they’ve assigned each state a percentage score for its election administration for every federal election from 2008 to 2014. In the 2014 election, the state with the best score was was North Dakota, with 84%; the bottom-scoring state was Alabama, with 49%.
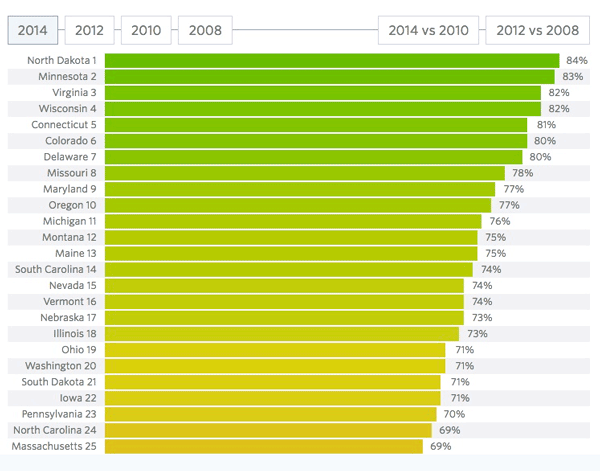
In their interactive data feature, you can view each state’s scores on all of the individual indicators, a ranked list of all the states, or compare states’ scores from election to election. It’s a great tool to see how voters in many states still face significant challenges in order to raise their voice in our democracy.
How does your state stack up in Pew’s rankings? Find out here.
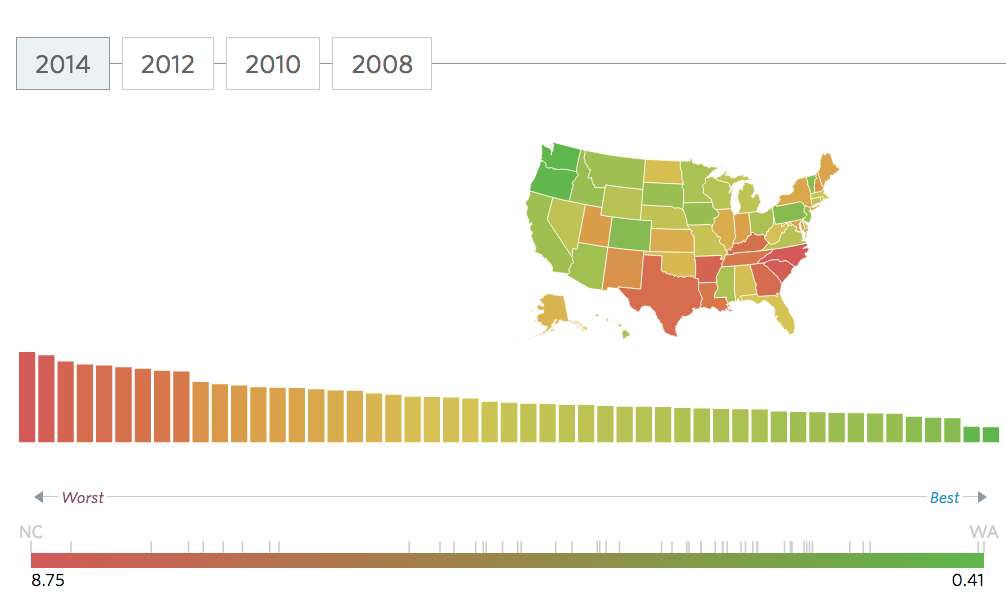
Pew Elections Performance Index: Voting Wait Time
The Pew Trusts’ Election Initiatives Project tracks a number of data points that provide insight into each state’s voting landscape: among these are turnout, voter registration, and the availability of online registration. One of the most telling indicators of a state’s success in managing elections is Voting Wait Time.
Although long waits can indicate excitement surrounding an election, significant variation in polling place lines across precincts and communities may mean that inefficient administration is making voting more difficult for some voters. Average wait time is one measure of the ease of voting: The less time a voter waits to cast a ballot, the more convenient the experience.
How does your state measure up? Find out at PewTrusts.org.
New Survey Shows Strong Support for Paid Family Leave Fund
Paid family leave, paid sick leave, and affordable childcare: these aren’t political talking points, they’re the sort of public policies that will allow working families – including Unmarried Women and the Rising American Electorate – to succeed in today’s economy. A new poll commissioned by the Work Family Strategy Council shows that these policies enjoy overwhelming support with American voters: “By a nearly 2-1 margin, 61 percent of voters in these states, which include Iowa, support the creation of a national paid family and medical leave fund, 69 percent support a paid sick days law, and 57 percent support increasing access to high-quality, affordable child care, according to the survey. Among Iowans polled, 63 percent said they support a national paid family and medical leave fund, while 25 percent said they oppose it.”
Other critical takeaways from the poll include:
- “Overall, a majority of voters in the 15 states believe a national paid family and medical leave fund would make the country better off, while only 26 percent think it would make the country worse off.”
- “Voters across states say they favor a law that would create a national paid family and medical leave fund: 61 percent say they favor such a law, 44 percent say they strongly favor one, while 34 percent are opposed.”
- “A strong majority of people surveyed say they face challenges when managing job, family and personal responsibilities: 63 percent of full-time workers and 67 percent of part-time workers say they would be likely to face significant economic hardship if they had to take time from their jobs without pay to care for a new child, care for a seriously ill loved one or deal with their own serious health issue.”
Read the full article at Business Record.com
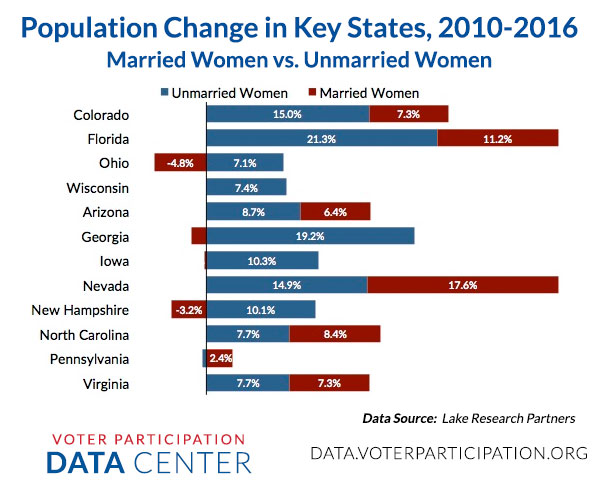
Unmarried Women: Growing in Numbers and the Power to Decide 2016 Elections
There are more than 58 million single women eligible to vote this November. For the first time ever, there are more single women than married women eligible to vote, and their numbers continue to grow nationally and in key states. And as the new poll of nine battleground states conducted for Women’s Voices Women Vote Action Fund shows, single women could determine the outcome of the presidential election and U.S. Senate races down-ballot.
Chart: Rising American Electorate vs. Non-RAE Percent Change
This chart showing the growth of the Rising American Electorate – unmarried women, people of color, and Millennials – in key states between 2010 and 2016 demonstrates quite clearly how broadly and quickly the face of America is changing.
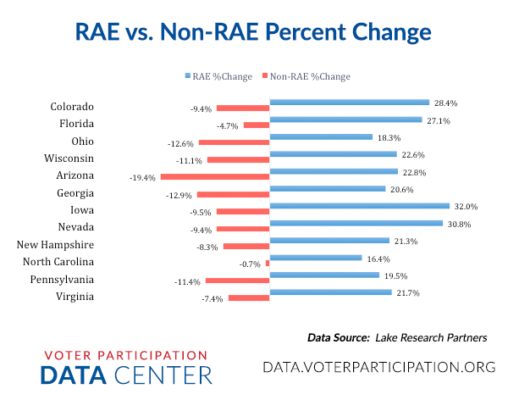
All information was provided by Lake Research Partners.