Equal Pay Day 2017: Unmarried Women and the #WageGap
April 4, 2017 is Equal Pay Day 2017 — the date that symbolizes how far into 2017 the average woman has to work in order to make the same amount as the average man.
September 26 is National Voter Registration Day… and to commemorate this occasion, we’re teaming up with Lake Research Partners to release the most comprehensive political analysis of the Rising American Electorate in the 2016 elections.
In 2016, for the first time in American history, the Rising American Electorate — which makes up the majority of citizens eligible to vote at 59.2% — also cast the majority of ballots, at 52.6%. But nearly two-thirds of the projected drop-off for the 2018 election will come from the RAE, and large percentages of unmarried women (32.5%), Latinos (42.7%), and millennials (39.3%) aren’t registered to vote — underscoring the huge potential of the RAE and the importance of making sure that every eligible American is registered to vote.
The report provides a thorough breakdown of demographic information from the 2016 election including dissecting data by state, analyzing how ballots were cast, comparing registration and turnout rates, population mobility, methods of registration, reported reasons for not registering, economic factors and expected 2018 drop off.
The VPC research team has prepared this update based on the Census Bureau’s September 2017 data release, containing data for calendar year 2016. The final year of the Obama administration was generally filled with good economic news: median household income rose, the number of people in poverty fell, and the uninsured rate decreased. Read the full report below.
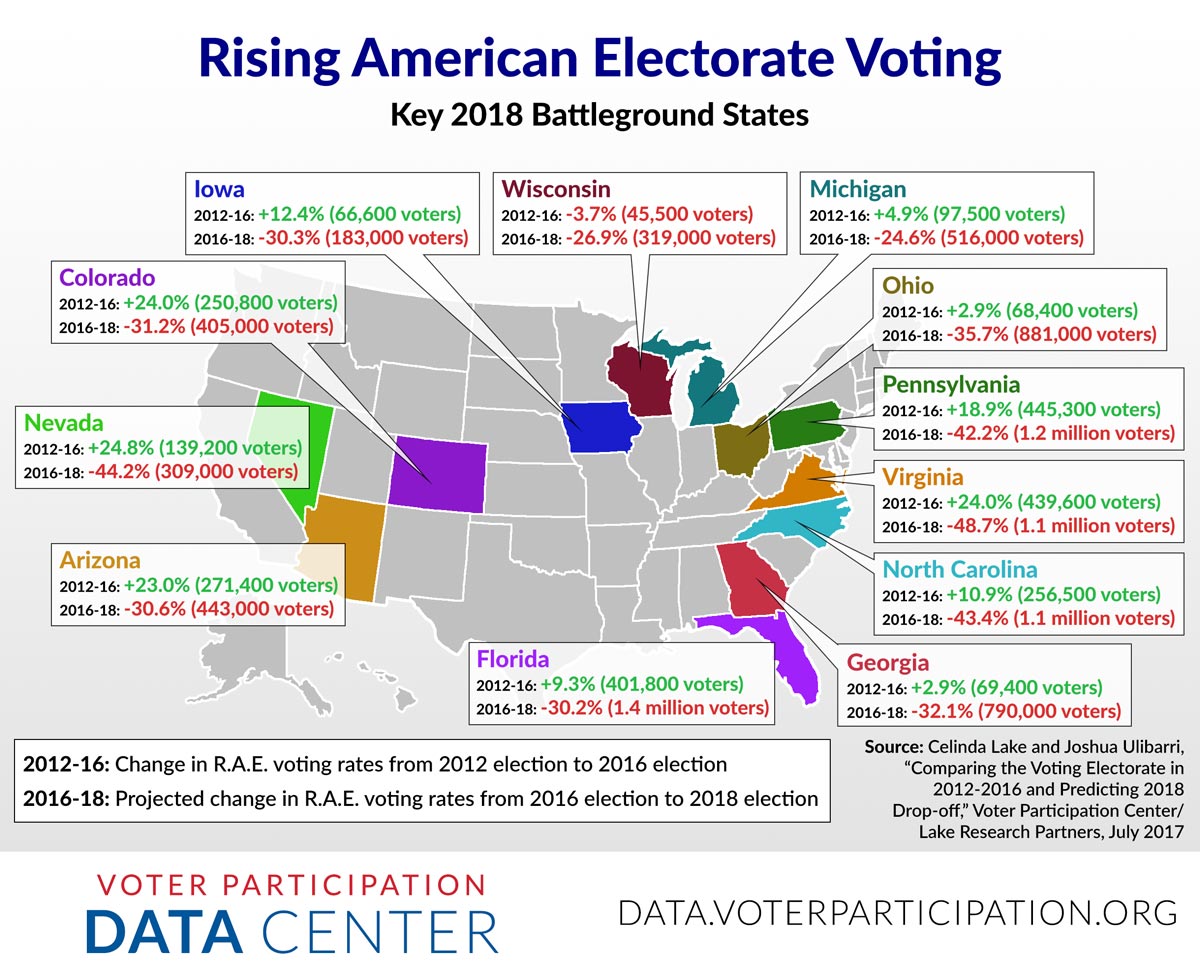
As part of our ongoing efforts to understand the voting patterns of the Rising American Electorate, we’ve worked with Lake Research Partners to produce this report, which catalogues the changes in voting turnout for the Rising American Electorate between 2012 and 2016 – and makes projections for voter drop-off in 2018.
The projections are sobering and troubling to everyone who cares about increasing participation in our great democracy. Our prediction is that 40 million Americans who voted in 2016 won’t cast a ballot in the 2018 midterms — and to make matters worse, 2/3 of those drop-off voters will be members of the Rising American Electorate. The RAE dropoff is projected to be particularly pronounced in key 2018 battleground states, such as Arizona, Nevada, Florida, and Ohio:
Add in the effects of ongoing vote suppression efforts and the implication is clear: Democracy is facing a headwind in 2018. We need to double down on voter registration, mobilization and turnout efforts, and fighting for voting rights in order to make sure that every American has the opportunity to raise their voice at the ballot box.
Will nonmetropolitan America hold on to its outsize political clout? Perhaps not, according to some incisive analysis from William H. Frey at Brookings:
“Newly released census statistics for 2016 confirm that diversity in the United States continues to rise. For the first time, the population under age 10 has become minority white (white non-Hispanic) as the Hispanic, Asian, black, and other racial minority populations continue to rise up the age structure (download Table 1). The new numbers also show that Nevada has joined the ranks of states with minority white populations, along with Hawaii, California, New Mexico, and Texas, as non-white racial groups continue to disperse (download Table 2). Yet one part of the nation continues to stand out for its slow embrace of the diversity surge: the 14 percent of the population that lies outside the nation’s metropolitan areas.
This is noteworthy in light of the huge attention given to nonmetropolitan America in the aftermath of the 2016 election because of its strong support of President Trump. Not only has the nonmetropolitan population remained much whiter than the rest of the nation, it is also getting older faster and shrinking in size. Despite its unmistakable impact on last year’s election, the demography of nonmetropolitan America—distinct from the rest of the country—may limit its long-term political clout.”


The Brookings report examines trends in race, age, and population growth – each of which indicate a retraction in nonmetropolitan America’s sway.
“Despite constituting a small and declining portion of the population both nationally and in most states, nonmetropolitan voters demonstrated substantial political influence during the latest election cycle. Can this sliver of the population continue to exert such clout?
It will certainly be more difficult. To be sure, there is wide variation among small nonmetropolitan areas—ranging from those with once-thriving farming and manufacturing sectors to those that are investing in newer industries. It is also possible that the population losses seen in many rural areas and small towns in the post-recession period may be less severe as the economy improves. But the new census statistics make plain that this segment of the nation’s population remains distinct on key demographic dimensions in sharp contrast to a much larger, growing and more diverse urban America.”
Check out this deep dive from four Washington Post reporters:
“Using data from the voter file vendor Catalist and information from the U.S. Census Bureau, we examine the change in turnout rates for different racial/ethnic groups between 2012 and 2016. Black turnout declined dramatically; white turnout increased noticeably; and Latino and Asian American turnout went up even more. In the key swing states of Michigan, Wisconsin, and Pennsylvania, those shifts were especially strong. How strong? Without those shifts in turnout from various racial and ethnic groups, these pivotal states might have gone not to Trump but to Clinton — giving Clinton an electoral college victory.”
Two graphics in their piece show the stark difference in turnout:
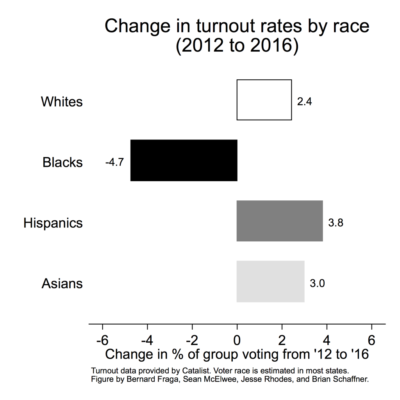
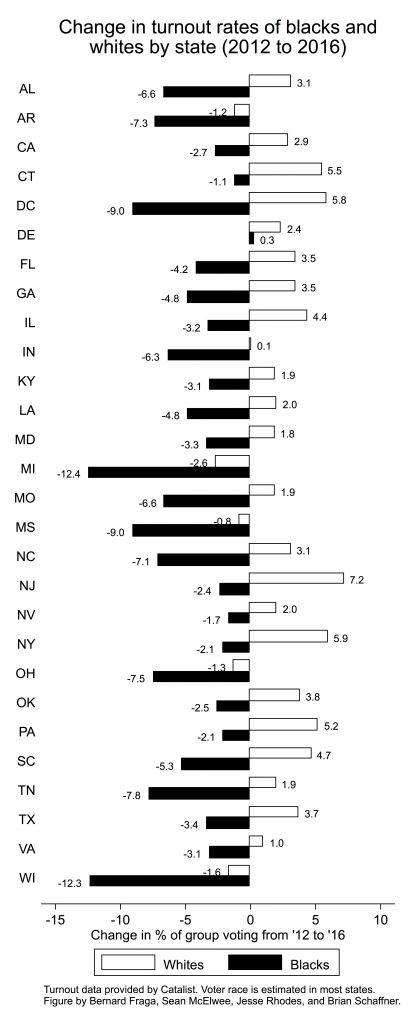
“As you can see, the national average hides dramatic differences among states. For example, as we’ve said, the African American turnout rate fell by 4.7 points nationally. But in Michigan and Wisconsin — two key Midwestern states where, to analysts’ surprise, Trump won — black turnout fell by more than 12 points.
Similarly, overall white turnout increased by only 2.5 points nationally. But in several states it surged by more than 5 points. In the critical battleground state of Florida, white voter turnout jumped by 4 points — and black turnout fell by 4 points. Trump won Florida by a margin of just 1.2 points.”
So, in the end, what impact did decreased / depressed turnout of Black voters have on the election?
“If we changed nothing but the turnout rates of various racial and ethnic groups, in Michigan, the actual Clinton loss by .2 percentage points would have become a victory by 1.5 percentage points. Clinton’s actual loss by 0.7 percentage points in Pennsylvania would have been a 0.5 percent victory. And instead of Trump winning Wisconsin by 0.8 points, Clinton would have won by 0.1 percent. Clinton’s electoral college total would have been 278 votes, putting her in the White House.”
“Of course, these measures are estimates and subject to error. Interpret cautiously. But what’s clear is that the jump in white turnout in key swing states and drop in black turnout may well have handed the presidency to Trump.”
Ari Berman writes in The Nation:
A new study by Priorities USA, shared exclusively with The Nation, shows that strict voter-ID laws, in Wisconsin and other states, led to a significant reduction in voter turnout in 2016, with a disproportionate impact on African-American and Democratic-leaning voters. Wisconsin’s voter-ID law reduced turnout by 200,000 votes, according to the new analysis. Donald Trump won the state by only 22,748 votes.
The study compared turnout in states that adopted strict voter-ID laws between 2012 and 2016, like Wisconsin, to states that did not.”
“While states with no change to voter identification laws witnessed an average increased turnout of +1.3% from 2012 to 2016, Wisconsin’s turnout (where voter ID laws changed to strict) dropped by -3.3%. If turnout had instead increased by the national- no-change average, we estimate that over 200,000 more voters would have voted in Wisconsin in 2016.”
Read the full story at The Nation.
54 years after the Equal Pay Act was signed into law, women are still fighting to earn the same earnings as men for equal work. According to the most recent data on 2016 available from the U.S. Census Bureau, women on average make 80 cents for every dollar a man makes.
Earning disparities are even greater for unmarried women, who have seen a steady three-year decline on their earnings in comparison to married men. Unmarried women now earn only 59 cents to every dollar a married man earns, part of an ever-consistent pattern of unmarried women being left behind, even in a growing and improving economy.
In short, there have been no real substantive gains for women. In fact, equal wages is seeing a backwards trend while married men continue to see their earning power grow. Read about the particular difficulties facing unmarried women of color and single mothers and the real, day-to-day consequences of the pay gap.
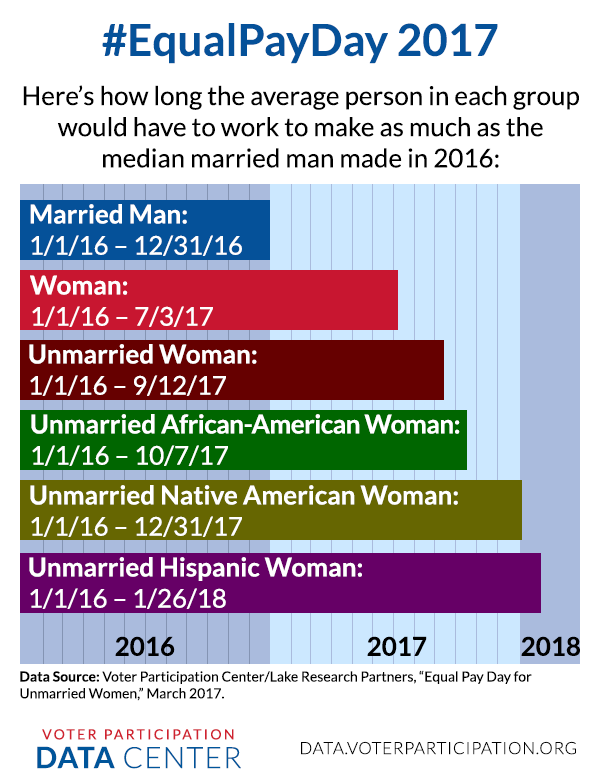
April 4, 2017 is Equal Pay Day 2017 — the date that symbolizes how far into 2017 the average woman has to work in order to make the same amount as the average man. According to 2016 US Census data, the wage gap for 2016 was the same as in 2015: for every $1 the average man is paid, the average woman is paid only $0.80.
Unmarried women are hit particularly hard by the wage gap. For every $1 the average man earns, the average unmarried woman is paid only $0.71… and for every $1 the average married man is paid, the average unmarried woman is paid only $0.59. That means that the average unmarried woman has to work until May 31, 2017 just to make the same as the average man did in 2016, and until September 12, 2017 to make the same as the average married man did in 2016.
And it’s even worse for unmarried women of color: For every $1 the average married man is paid, the average unmarried African-American woman is paid only $0.57, the average unmarried Native American woman only $0.50, and the average unmarried Hispanic woman only $0.48. That means that in order to make as much as the average married man made in 2016, the average unmarried Hispanic woman will have to work until January 26, 2018.
Here’s a state-by-state breakdown of the wage gap for unmarried women. What is the wage gap for your state?

For more details, read the full report from Lake Research Partners and the Voter Participation Center about Equal Pay Day for unmarried women.
Share this post widely on social media to raise awareness of the wage gap and the importance of #EqualPay.
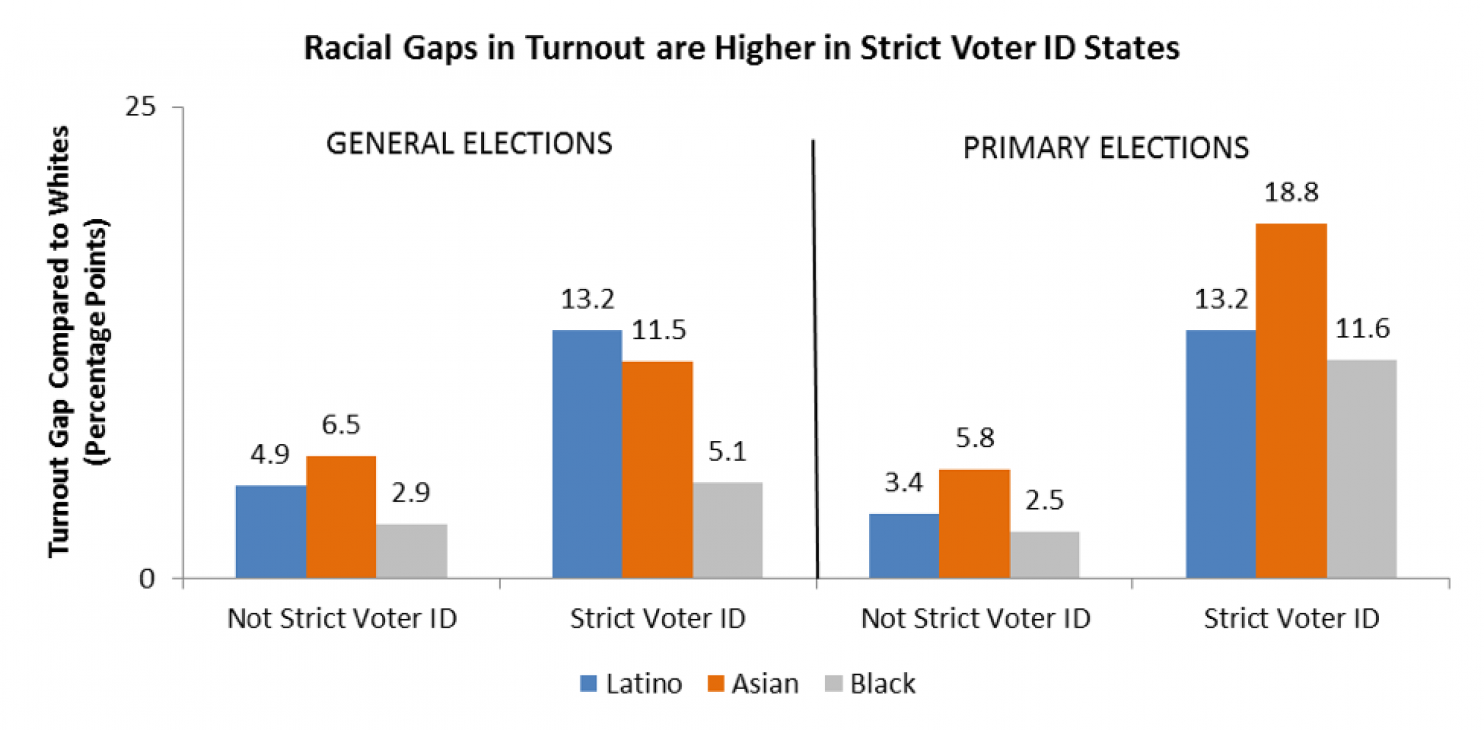
New research published in the Washington Post confirms one of the worst-kept secrets in politics: Voter ID laws suppress minority voting.
“When we compare overall turnout in states with strict ID laws to turnout in states without these laws, we find no significant difference. That pattern matches with most existing studies. But when we dig deeper and look specifically at racial and ethnic minority turnout, we see a significant drop in minority participation when and where these laws are implemented.
Hispanics are affected the most: Turnout is 7.1 percentage points lower in general elections and 5.3 points lower in primaries in strict ID states than it is in other states. Strict ID laws mean lower African American, Asian American and multiracial American turnout as well. White turnout is largely unaffected.
These laws have a disproportionate effect on minorities, which is exactly what you would expect given that members of racial and ethnic minorities are less apt to have valid photo ID.”
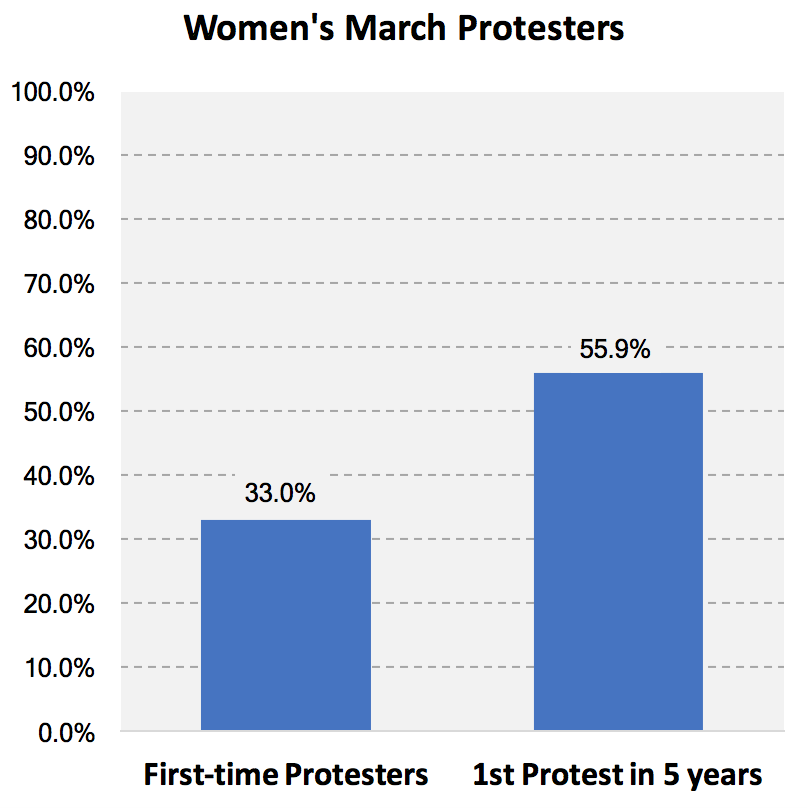
The numbers are in: “The Women’s March of 2017 was the largest protest in recent history, bringing together over 500,000 people in DC- the location of the flagship march, and over 2.9 million people nationwide.”
Their findings “suggest that the Women’s March has potentially lit the political fires of a new generation of activists and reactivated the political activism of others. Indeed, a third of the participants reported that the Women’s March was their first time participating in a protest ever. For over half of the participants (55.9%), the March was their first protest in 5 years (including those who had never participated before).”