Comparing the Voting Electorate in 2012-2016 and Predicting 2018 Drop-Off
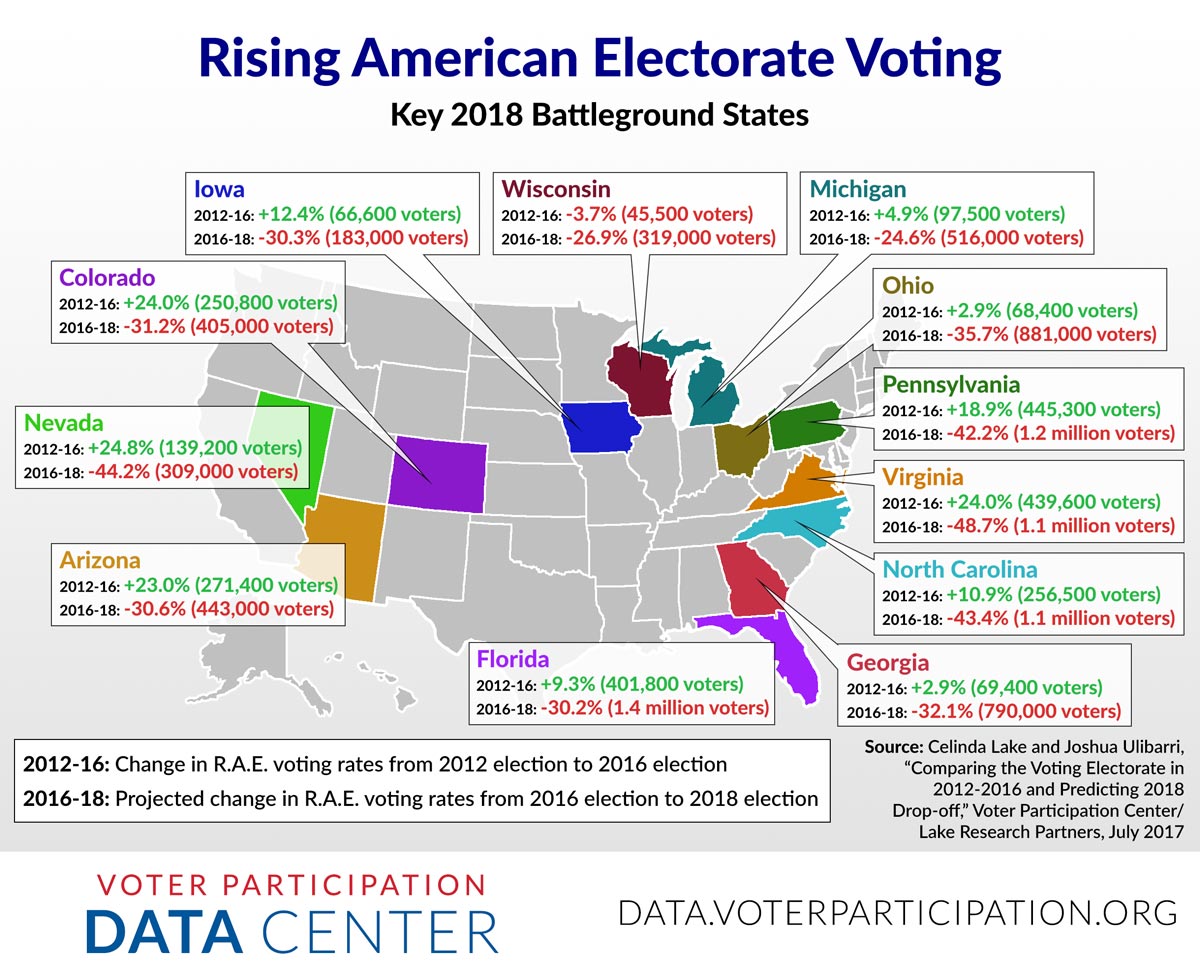
As part of our ongoing efforts to understand the voting patterns of the Rising American Electorate, we’ve worked with Lake Research Partners to produce this report, which catalogues the changes in voting turnout for the Rising American Electorate between 2012 and 2016 – and makes projections for voter drop-off in 2018.
The projections are sobering and troubling to everyone who cares about increasing participation in our great democracy. Our prediction is that 40 million Americans who voted in 2016 won’t cast a ballot in the 2018 midterms — and to make matters worse, 2/3 of those drop-off voters will be members of the Rising American Electorate. The RAE dropoff is projected to be particularly pronounced in key 2018 battleground states, such as Arizona, Nevada, Florida, and Ohio:
Add in the effects of ongoing vote suppression efforts and the implication is clear: Democracy is facing a headwind in 2018. We need to double down on voter registration, mobilization and turnout efforts, and fighting for voting rights in order to make sure that every American has the opportunity to raise their voice at the ballot box.
Downloads
Unmarried Women: Growing in Numbers and the Power to Decide 2016 Elections
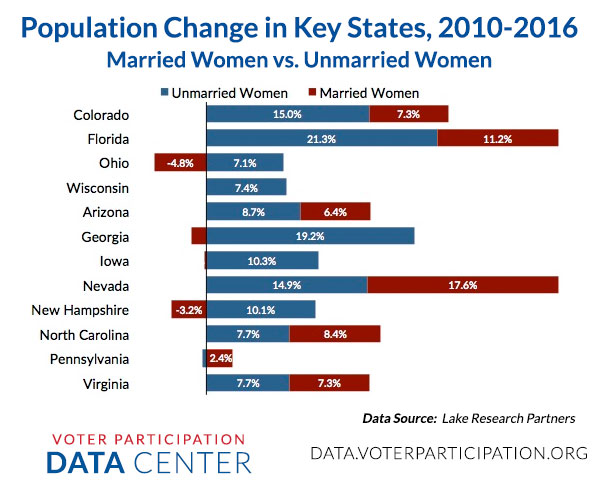
There are more than 58 million single women eligible to vote this November. For the first time ever, there are more single women than married women eligible to vote, and their numbers continue to grow nationally and in key states. And as the new poll of nine battleground states conducted for Women’s Voices Women Vote Action Fund shows, single women could determine the outcome of the presidential election and U.S. Senate races down-ballot.

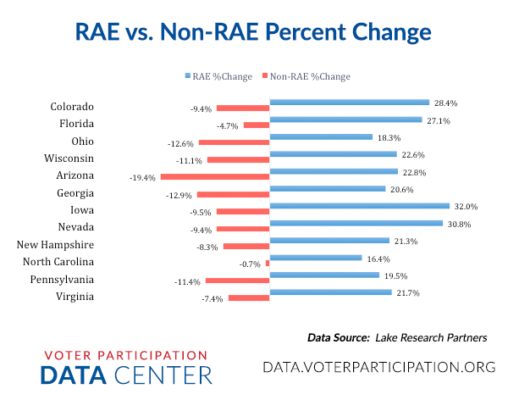
Chart: Rising American Electorate vs. Non-RAE Percent Change
This chart showing the growth of the Rising American Electorate – unmarried women, people of color, and Millennials – in key states between 2010 and 2016 demonstrates quite clearly how broadly and quickly the face of America is changing.

All information was provided by Lake Research Partners.
2016 Primary Spotlight: March 15
The 2016 presidential nominating contests could all come down to this Tuesday, March 15. Primary elections in five states could significantly winnow the race and give clearer shape to the general election.
The five states voting on March 15 will be:
For the GOP, the March 15 primaries include some winner-take-all states: Florida, Ohio, and possibly Missouri.* In most of the primaries this spring, delegates have been awarded proportionally, allowing several candidates to win delegates in a race.
So what does the Rising American Electorate—unmarried women, people of color, and millennials—look like in these make-or-break states? Remember that nationally, the RAE is the majority of eligible voters—almost 57%. And in 2016, for the first time in U.S. history, they’re poised to cast the majority of votes in an election.
Take a look at our breakdown of the RAE nationally and in each of the five March 15 states. As a reminder, a person can belong to more than one subgroup in the RAE—so an unmarried Latina millennial would show up as part of all three cohorts that make up the RAE.
| Rising American Electorate | Unmarried Women | People of Color | Millennials | |
| U.S. Vote-Eligible Population | 57% | 26% | 30% | 26% |
| Florida | 58% | 26% | 36% | 21% |
| Illinois | 58% | 28% | 30% | 27% |
| Missouri | 46% | 23% | 15% | 26% |
| North Carolina | 56% | 26% | 29% | 26% |
| Ohio | 48% | 26% | 16% | 21% |
* In the Missouri GOP primary, if one candidate gets over 50% of the vote, they will receive all of Missouri’s GOP delegates; if no candidate gets 50%, then the delegates will be allocated proportionally.
New Data for the New Year
Here’s an updated look at the median earnings, health insurance coverage and poverty rates for unmarried women in 16 states. These profiles provide detailed demographic and economic portraits of the growing number of increasingly politically-powerful single women.
| California Colorado Florida Illinois |
Iowa Kentucky Missouri Nevada |
New Hampshire New York North Carolina Ohio |
Pennsylvania Texas Virginia Wisconsin |
Unmarried Women: The Key to Unlocking the New American Electorate
An astonishing number of single women aren’t yet registered to vote. If we help even a small percentage more of unmarried women register and vote, we’d likely see different results up and down the ballot in key 2016 states.
(Click on a state name in the table to view our demographic profile of unmarried women for that state.)
| State | Unmarried Women | % of Vote-Eligible Population | Registered to Vote | Not Registered to Vote |
| Colorado | 830,224 | 22% | 546,725 (66%) | 283,499 (34%) |
| Florida | 3,637,949 | 26% | 2,184,986 (60%) | 1,452,963 (40%) |
| Iowa | 524,096 | 23% | 325,929 (62%) | 198,167 (38%) |
| Missouri | 1,010,097 | 23% | 665,390 (66%) | 344,707 (34%) |
| Nevada | 482,278 | 26% | 266,875 (55%) | 215,404 (45%) |
| New Hampshire | 239,332 | 24% | 146,705 (61%) | 92,627 (39%) |
| North Carolina | 1,803,826 | 26% | 1,147,794 (64%) | 656,032 (36%) |
| Ohio | 2,171,933 | 26% | 1,341,439 (62%) | 830,495 (38%) |
| Pennsylvania | 2,296,628 | 24% | 1,404,064 (61%) | 892,563 (39%) |
| Virginia | 1,399,995 | 24% | 831,891 (59%) | 568,104 (41%) |
| Wisconsin | 1,007,304 | 24% | 637,094 (63%) | 370,210 (37%) |
Data Source: Current Population Survey: Voting and Registration Supplement, 2014. U.S. Department of Commerce, Bureau of the Census.
Statistical Profile of Unmarried Women: Florida
Our research team has compiled available data from the US Census Bureau, the Bureau of Labor Statistics, and other sources to put together this statistical profile of the demographic and economic circumstances facing unmarried women in the state of Florida.
Report updated May 2017


